

New industry metrics to help publishers chart their growth plan
Posted:
Tuesday, May 29, 2012
The Publisher Edition will be the first in a series of publications looking at aggregated global data from across our display advertising solutions. We’re doing this to generate metrics that will answer a few of of the most common questions we hear from our partners, and put some data behind long-held industry assumptions. For example:
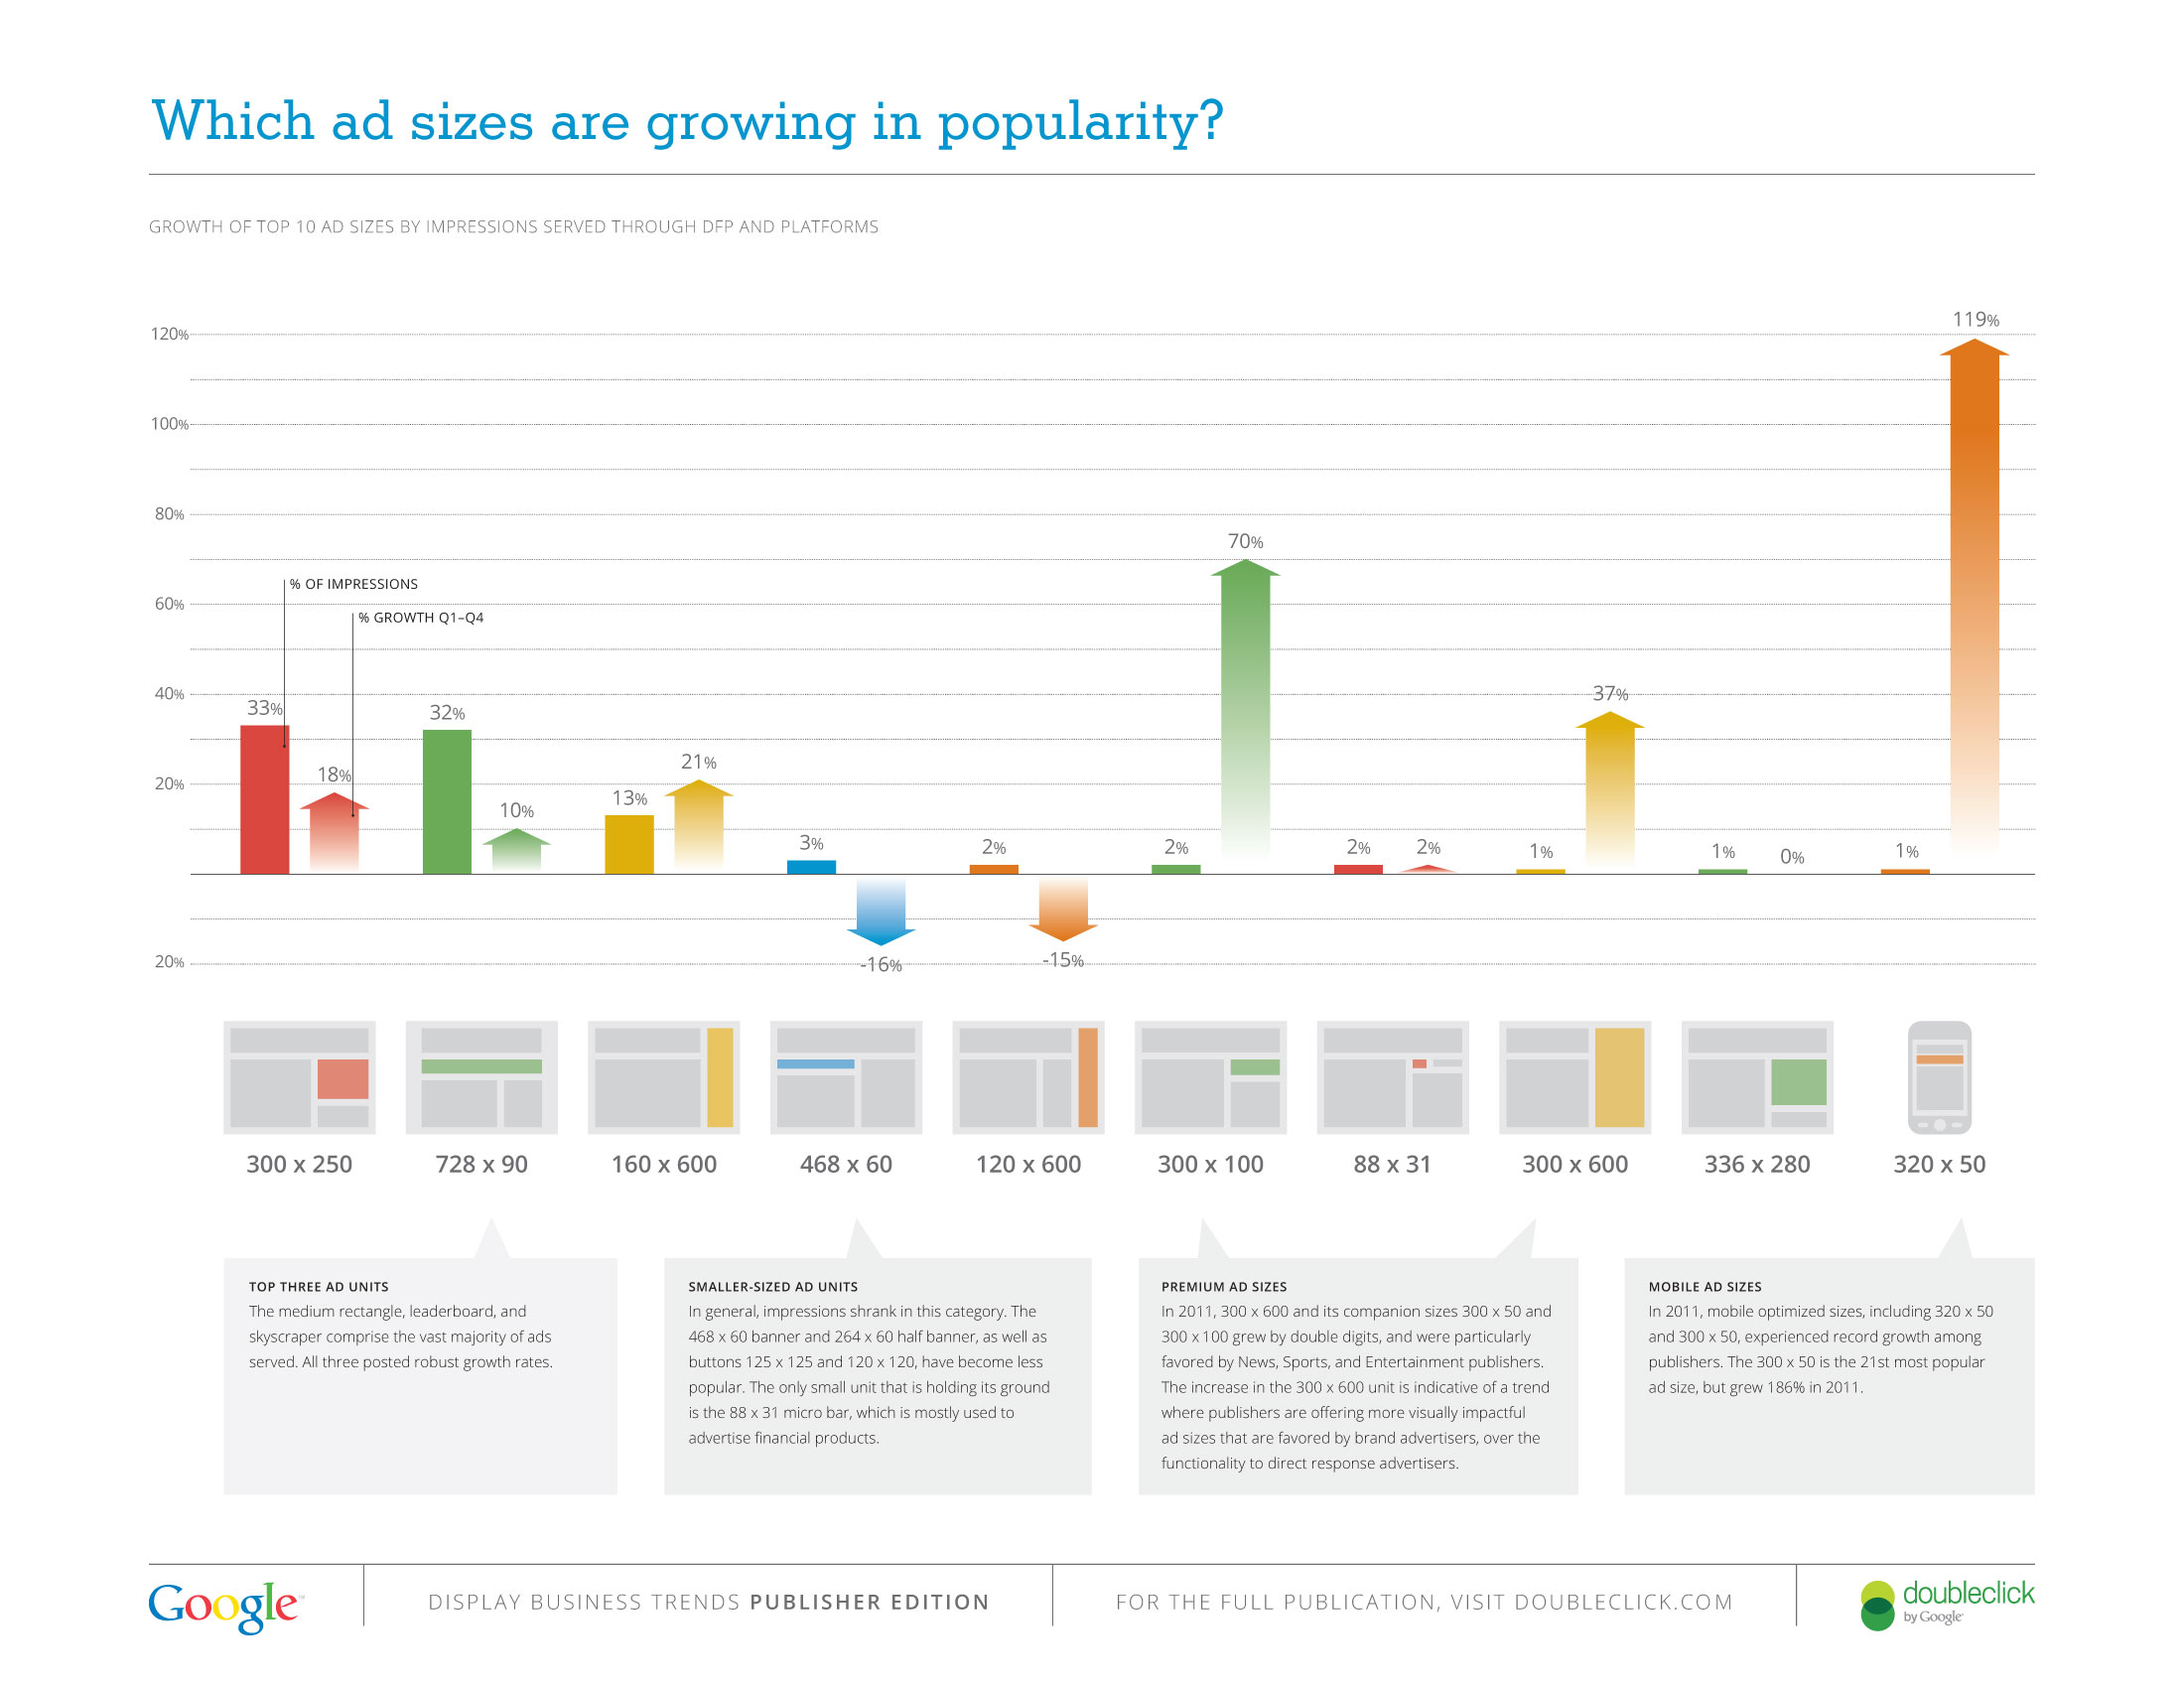
- Is the banner really dead? If you mean the 468x60 banner, then it might be time to hold a wake. This ad size dropped down to 3% of all impressions. Brand-friendly “premium” units are gaining share and we’re seeing that smaller ad units are dropping in popularity. However nearly 80% of all impressions are the ad unit “three musketeers”: the medium rectangle, leaderboard, and skyscraper still comprise the vast majority of ads served.
- What types of sites are showing strong impression growth? In 2011, we found that Shopping, Sports, and Auto & Vehicle sites were some of the fastest year-on-year growth verticals on the Ad Exchange and AdSense. We saw impressive figures across the board, with 15 out of 25 publisher verticals displaying double-digit growth.
- Are your sell-through rates getting a 17% holiday bonus? Anecdotally we’ve heard that publishers’ sell-through rates increase at the end of the year, thanks to higher advertiser holiday spending. We’re now able to quantify this end-of-year shift, and we found that the global publisher sell-through rate increases from 36% to 42% in the fourth quarter. Comparing the regions in 2011, European publishers experienced the greatest sell-through boost, increasing to 47%.
- How fast is the growth in mobile and video? Growth in mobile usage has exploded, with mobile web impressions on the Ad Exchange and AdSense platforms increasing by 250% from the third to fourth quarter in 2011. Over the same period, video ad impressions increased nearly 70% across the DFP Video platform.
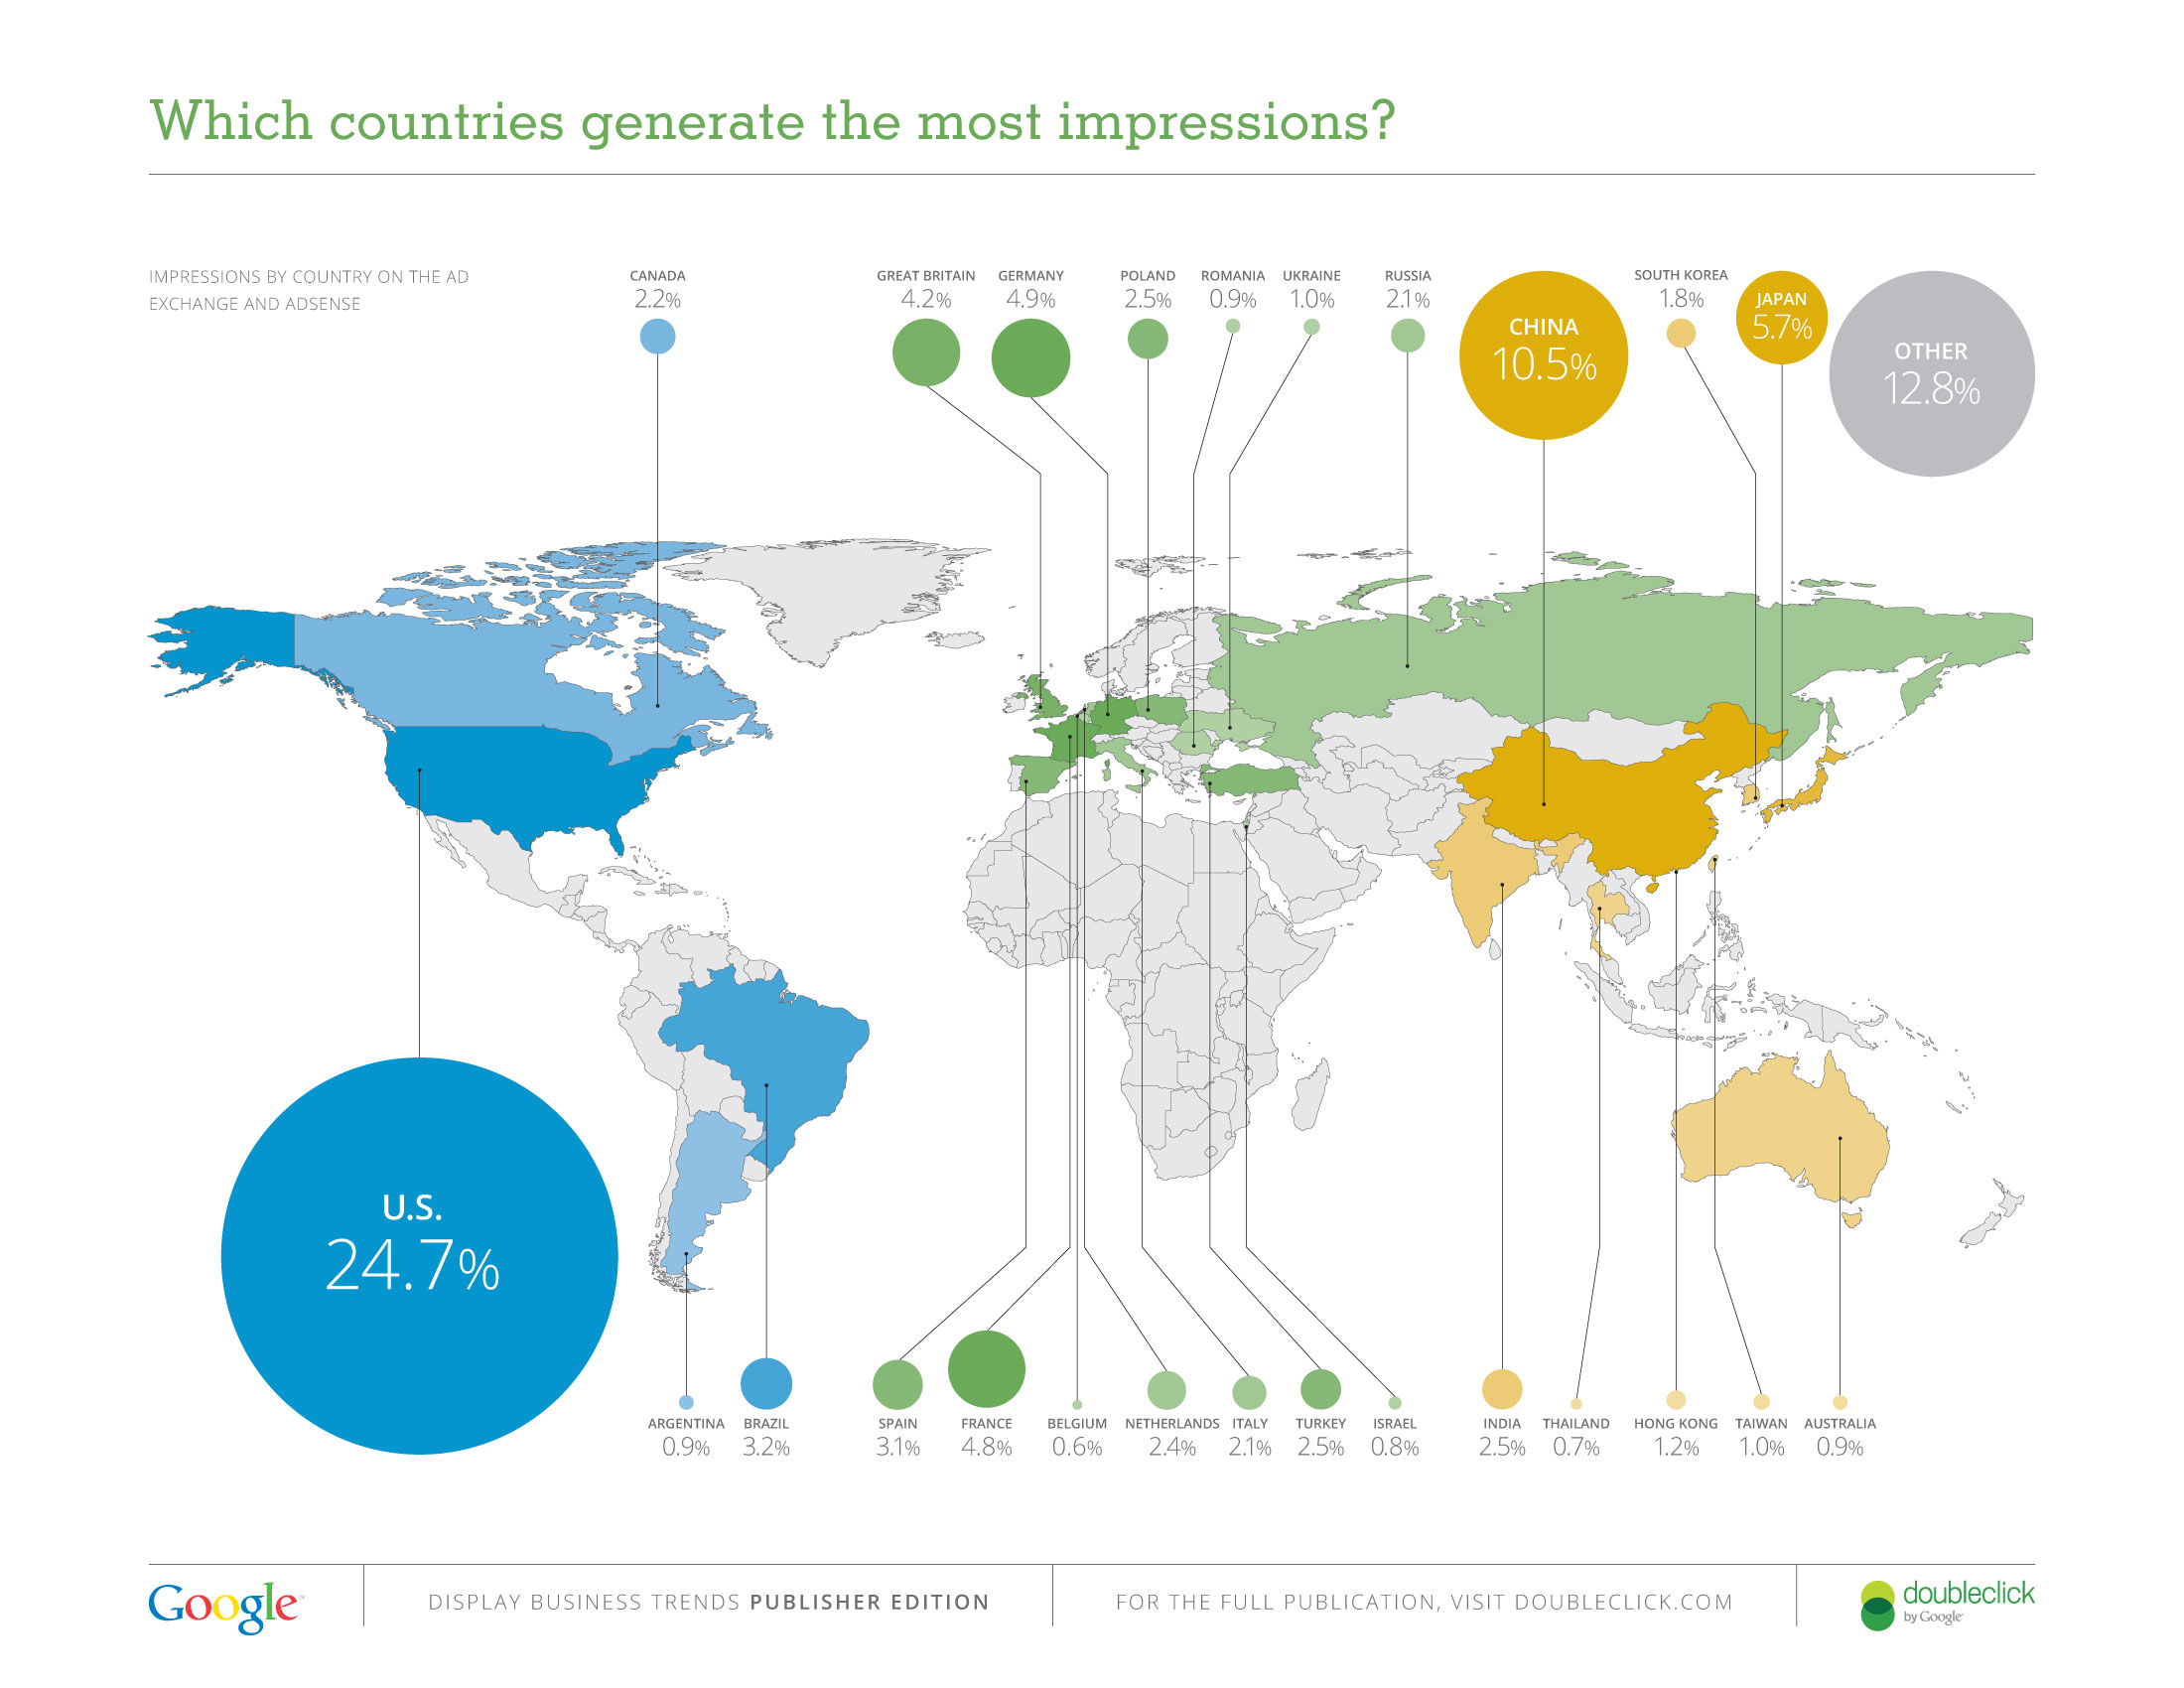
- Where in the world are you? All over, as it turns out. Of a possible estimated 245 different countries and territories, we saw publisher ad impressions from 235 of them. These included the island country of Palau - one of the world’s newest sovereign states - and the middle-African nation of Equatorial Guinea, with astounding growth rates of 1106% and 4635% respectively. And while the United States still accounts for the highest percentage of impressions overall, we’re seeing a significant representation from China and Japan, coming in at 11% and 6% respectively.

For our part, we’ll be continuing the conversation at DoubleClick Insights on June 5th, where we’ll be live-streaming our discussion on the future of buying and selling ads online. We hope you’ll join us there!
Posted by Jonathan Bellack, Director of Product Management, Display Advertising.